A blog about finance literacy in Singapore context
-
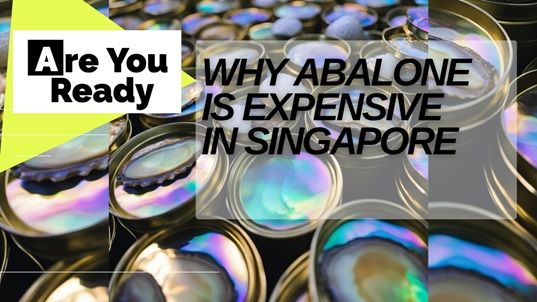
Why Abalone Is So Expensive in Singapore
Abalone’s high price in Singapore is due to its scarcity, slow growth, and demand in Asian cuisine. Its rarity and unique taste make it a luxury delicacy.
-
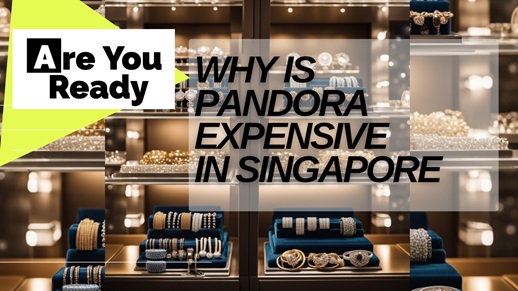
Why Is Pandora Jewellery So Expensive in Singapore and Is It Truly Valued?
Pandora jewellery stands as a hallmark of luxury and style in the global market, sparking interest and desire among consumers in Singapore. The brand, known for its charm bracelets, rings, and necklaces, often carries a premium price tag that leaves many questioning the factors contributing to its cost. In my examination of why Pandora’s items…
-
What Is Singapore’s Average Household Income and How It Differs From Individual Salaries 2024
Explore how Singapore’s average household income varies. Understand the different salary brackets and their impact on living standards.
-
What’s the Median Salary in Singapore by Age, Gender, Education, and Race 2024: An In-Depth Analysis
Median salary in Singapore varies by age, gender, education, and race. Know where you stand in the income distribution.
-
WeBull Singapore Review
Most beginners find investing an intimidating ordeal. But unlike in the past, today it is much easier to start, thanks to new platforms and tools. WeBull is one of the beginner-friendly investing platforms that traders can leverage. In this review, we will dive deep and get to understand what WeBull is, and what it can…
-
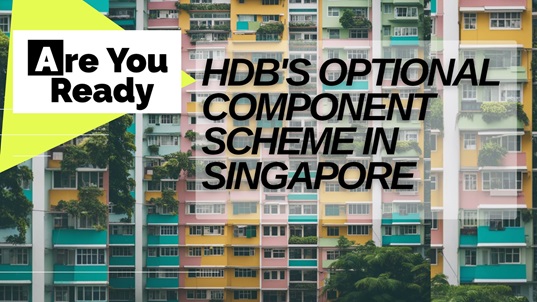
Complete Guide to HDB’s Optional Component Scheme in Singapore 2024
Discover if the HDB Optional Component Scheme is right for you with our in-depth analysis. Weigh the pros and cons before deciding!
-
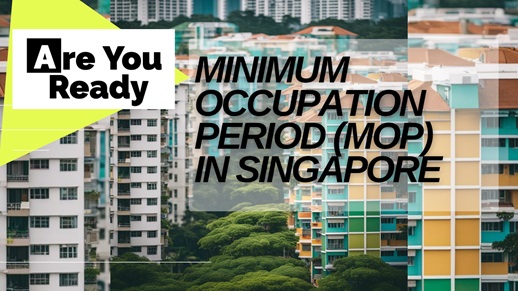
Guide to Minimum Occupation Period MOP Singaporeans: Insights on MOP 2024
In Singapore, owning a flat comes with an understanding of specific housing rules, one of which is the Minimum Occupation Period, commonly known as the MOP. It’s a feature of the housing policy that mandates a period of time a homeowner must physically occupy their flat before they can sell it on the open market.…
-
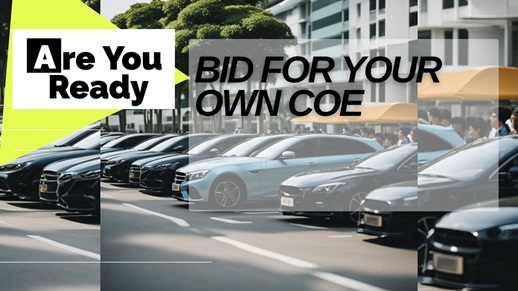
Can You Bid for Your Own Certificate of Entitlement (COE) in Singapore? Explained 2024
Bid for your own COE in Singapore and take control of your vehicle ownership. Learn how with our guide!
-
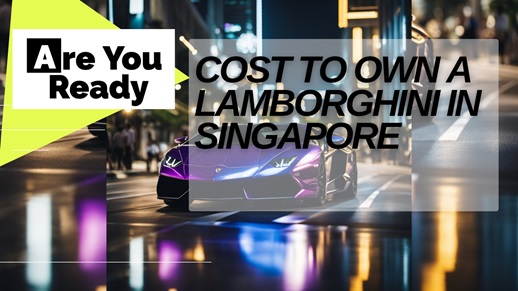
How Much Does It Cost To Own A Lamborghini In Singapore 2024
Own a Lamborghini in Singapore? Discover the real cost of luxury on wheels. Drive your dream—responsibly.
-
Guide to Getting Your Hands on the Coveted UOB Lady’s Solitaire Card 2024
Maximize rewards with UOB Lady’s Card. Indulge in tailored perks for the modern woman. Read our review for insights!
-
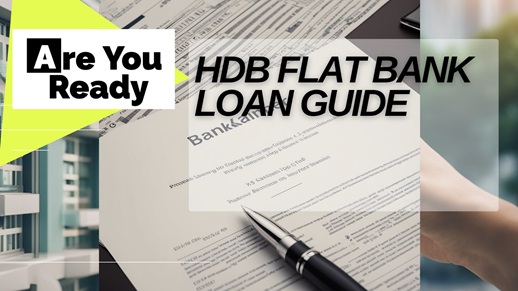
HDB Flat Bank Loan Guide 2024: Your Step-by-Step Guide to Simple Financing
Last updated: March 2024 Securing a bank loan for an HDB flat is a critical step for many Singaporeans looking to purchase their home. The process involves a series of steps, starting with eligibility checks and culminating in the disbursement of funds. I understand that navigating the complexities of loan applications can be daunting, which…
-
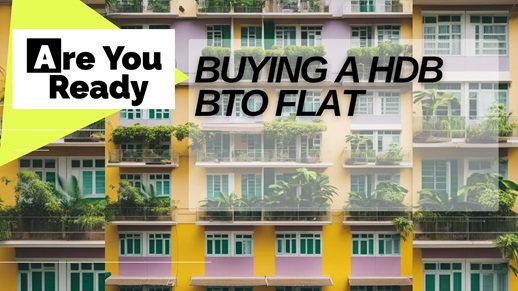
Buying a HDB BTO Flat 2024: Your Essential Step-by-Step Guide
Last updated: March 2024 Purchasing a Housing Development Board (HDB) Build-To-Order (BTO) flat in Singapore is a major milestone for many individuals and families. It’s a process that involves several stages, from eligibility checks to the selection of a unit and obtaining a loan. I understand the significance of each step and the importance of…